GNU Profiler - gprof#
gprof - How it Works#
How does it work?
Compiler inserts hooks into each function ⟶ counts number of calls
Signal handler runs periodically to gather statistic information about each call
$ gcc -pg -c -o program.o program.c
$ gcc -pg -g -c -o program.o program.c # debug info
$ gcc -pg -o program program.o
Running
programcreates a filegmon.outin the current working directoryInterpreted by
gprof
Using gprof#
$ gprof program gmon.out
...
Prints plenty of information
Flat profile: (sorted) list of functions and their numbers. Good to initially find out about the hot spots.
Call graph: node-by-node listing of call graph
Explanations of both (suppress with
--brief)
gprof: Flat Profile#
$ gprof --brief --flat-profile program gmon.out
  %  cumulative  self             self    total
 time  seconds  seconds    calls us/call us/call name
 89.96     1.02    1.02 38000000    0.03    0.03 contains
  9.80     1.13    0.11  1000000    0.11    1.10 find_duplicates
% time: percentage of entire runtime, including called subroutinescumulative seconds: same in secondsself seconds: time consumed by the function alone. The most valuable information ⟶ primary sorting criterioncalls: total number of calls
gprof: Call Graph#
$ gprof --brief --graph program gmon.out
index % time    self  children    called     name
...
-----------------------------------------------
                0.11    0.99 1000000/1000000     main [1]
[2]     97.6    0.11    0.99 1000000         find_duplicates [2]
                0.99    0.00 37000000/38000000     contains [3]
-----------------------------------------------
...
The
indexline is the center (what the node is about)Lines above: callers
Lines below: callees
3/291: 291 total calls, 3 attributed to one particular caller
gprof: Interpreting The Results#
Identify hot spots
Flat profile gives the hot spots ⟶ self seconds is the primary criterion
Scripting always possible if more is wanted
Call graph starting at the hot spots
$ gprof --brief --graph -f contains program gmon.out
...
index % time  self children    called       name
              0.00   0.00 1000000/38000000   main (6)
              0.00   0.00 37000000/38000000   find_duplicates (2)
[1]      0.0  0.00   0.00 38000000       contains [1]
...
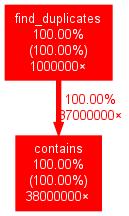
gprof: Visualization#
$ gprof program gmon.out | \
     gprof2dot | \
     dot -Tjpeg | \
     display -
|
|